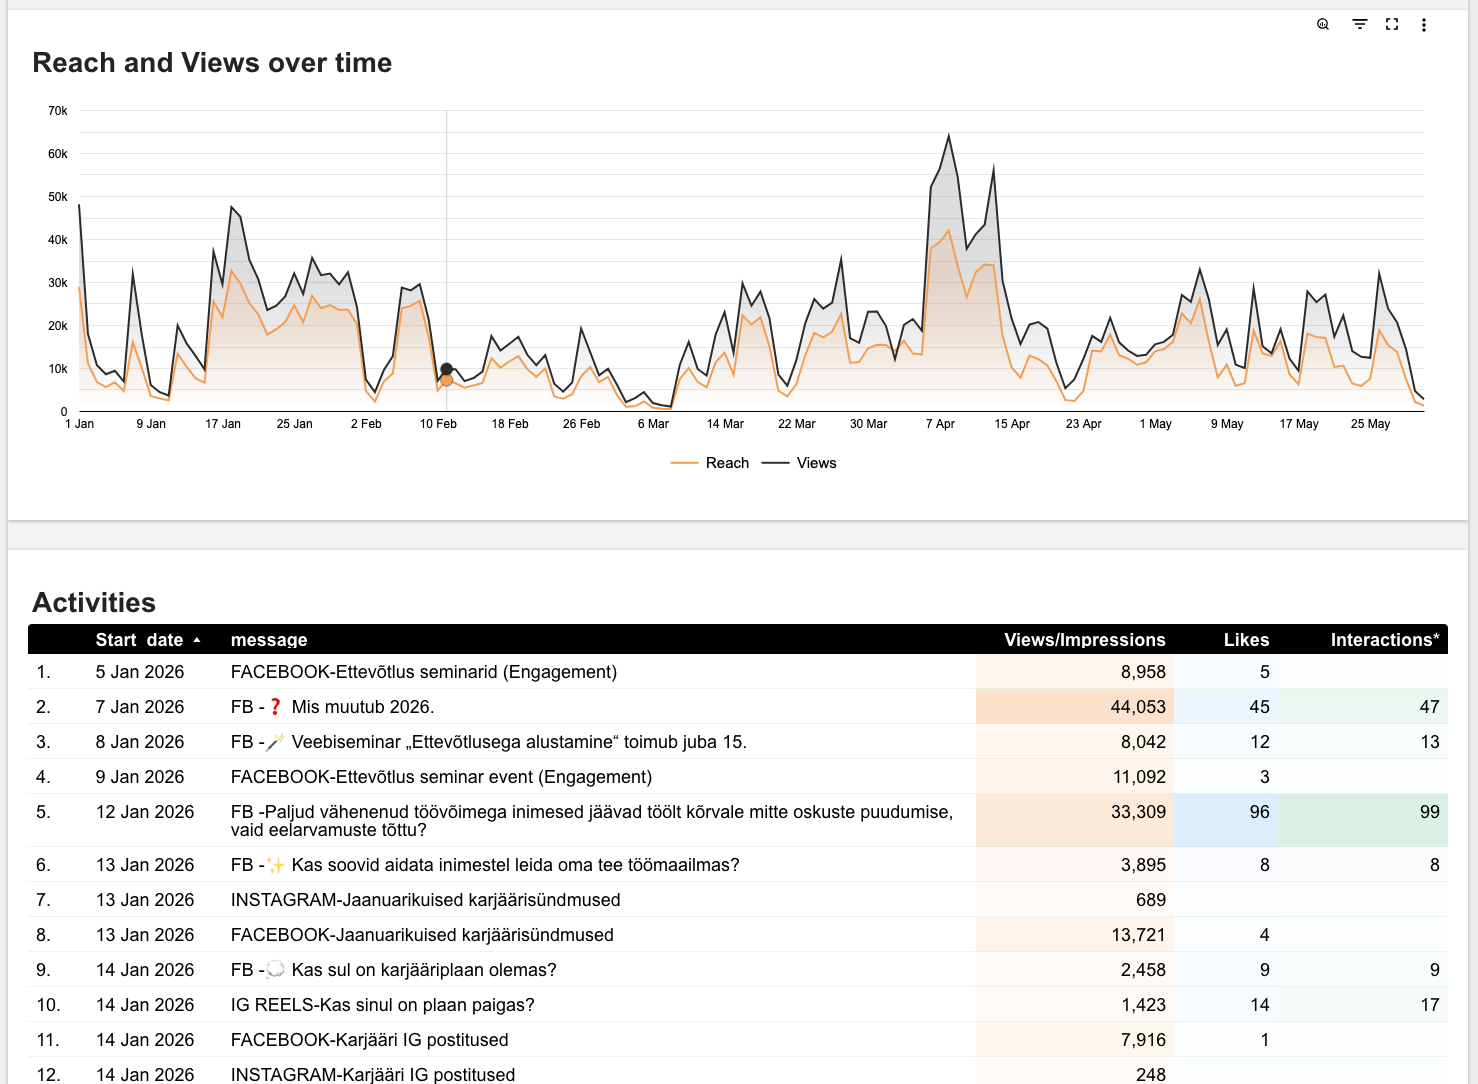
What kinds of posts resonate with your followers? How do results change over time, and what are your competitors doing in the meantime? To answer these questions, we’ve created a social media dashboard that brings together metrics from your company’s own channels as well as an overview of your competitors’ activities—all in one place.
In the “My Channels” view, you can track key metrics for Facebook and Instagram: the number of followers and follower growth, content views, reach, engagement, and clicks. This makes it easier to evaluate your performance so far, notice changes in your results, and develop ideas for future posts.
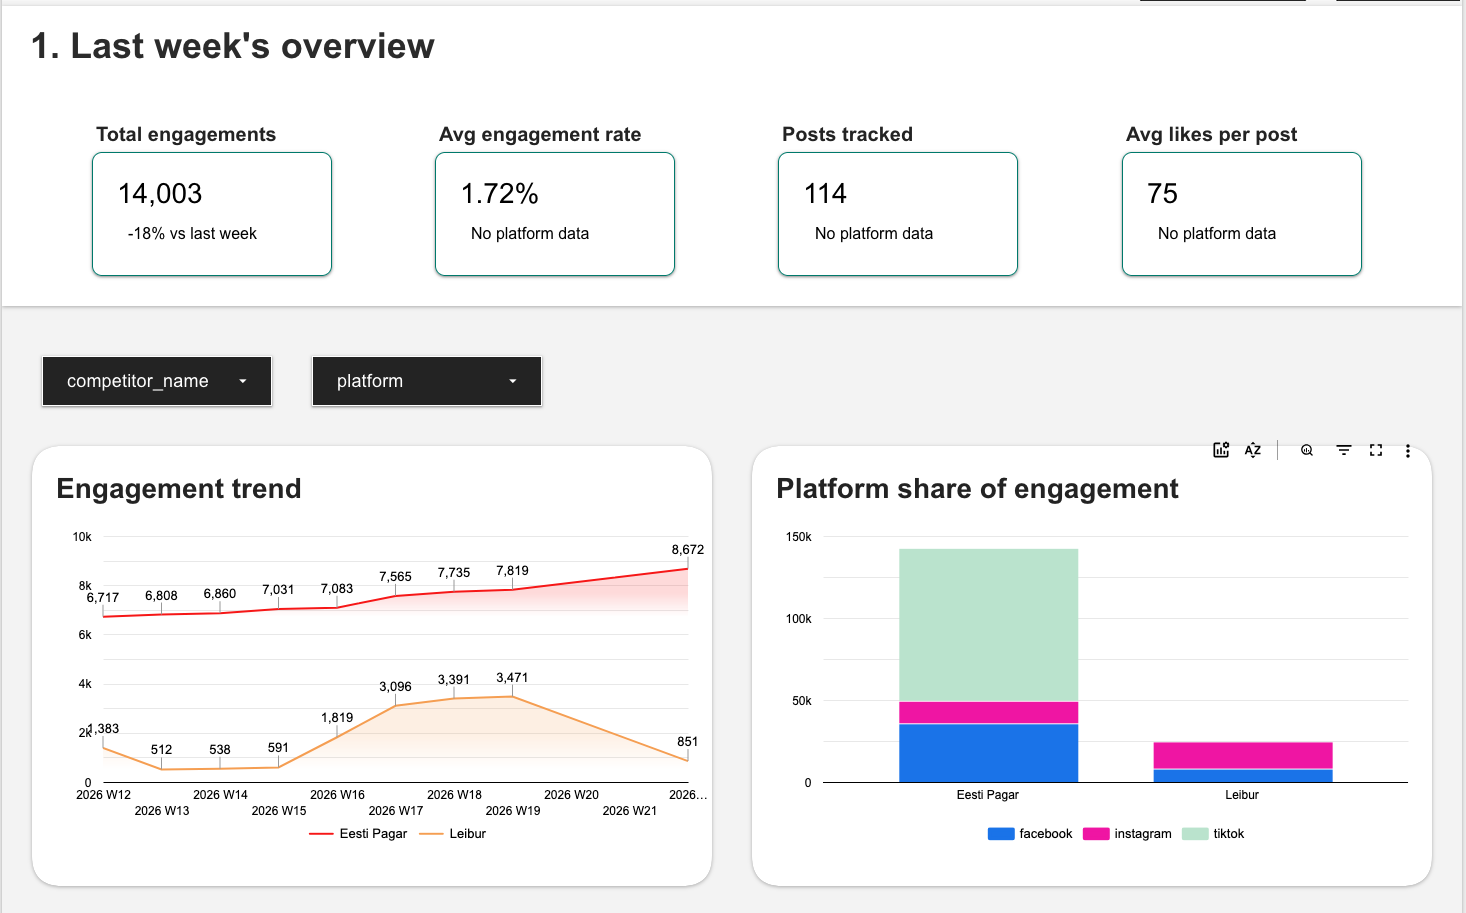
The Competitors view provides a broader context for your results. There, you can compare trends among your competitors’ followers, posting frequency, and engagement on Facebook, Instagram, and TikTok. You can also view the posts that have garnered the most attention and explore the topics and formats your competitors are using. This helps you stay aware of what’s happening in the industry and gain inspiration from various content strategies.
The purpose of the Dashboard is to make social media analytics easier, faster, and more useful in day-to-day work. Having all this information in one place reduces the need to switch between different channels and spreadsheets and helps you make more informed decisions about content and campaigns. By monitoring your competitors’ activities alongside your own results, you gain a broader picture of what’s happening on social media, making it easier to assess what aspects of your own strategy to further develop and which new approaches are worth testing.